Hypothesis Testing and p-value.

Hypothesis Testing
Hypothesis testing is done to evaluate two mutually exclusive statements which means either one of the statements can be true on a population data using a sample data.
Let’s take simple statements like:
Statement 1. This is a dog.
Statement 2. This is not a dog.
Steps for hypothesis testing
- We have to make initial assumption or statement H0 called as null hypothesis.
- And second is H1 also called as alternative hypothesis. Which is opposite of the null hypothesis.
- Start collecting the data according to your scenario.
- Then based on the data we have to find out whether to accept the null hypothesis or reject the null hypothesis.
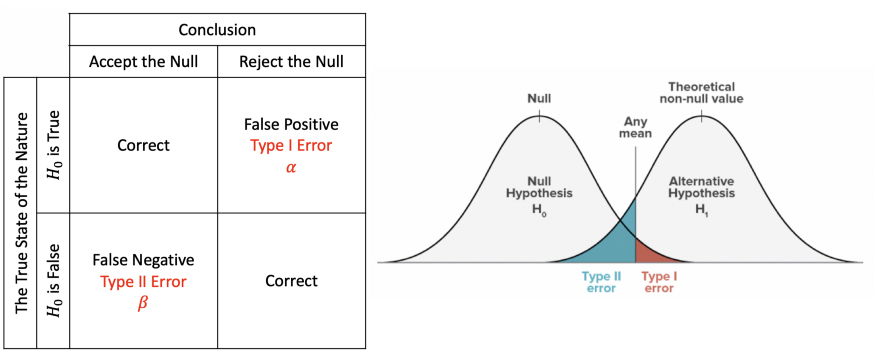
Type 1 and Type 2 Error
- In some scenario it can happen due to lack of data you reject the null hypothesis even if the null hypothesis is true this is called as a Type 1 error.
- And sometimes it can happen that you accept the null hypothesis even if the null hypothesis is not true is called as Type 2 error.
Type 1 and Type 2 error plays a major role in the hypothesis testing.
 |
|---|
| Type 1 and Type 2 Error. |
p-value
P value plays a very important role in the hypothesis testing. It helps to decide whether to accept null hypothesis or reject the null hypothesis.
So, what is exactly P Value?
Example: A ratio of girls and boys passing in a classroom..
Null Hypothesis
Ratio of girls and boys passing the exam is same.
Alternate Hypothesis
Ratio of girls and boys passing the exam are different.
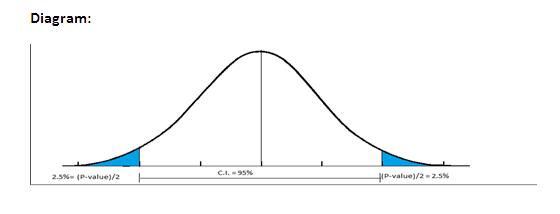
P is the significance value. P is the measure of how likely is that observed difference is due to the chance. So more the value of P more you are towards accepting the null hypothesis. Less the p value less you are towards accepting the null hypothesis. But there must me some threshold point of this P-value. So, if p < 0.05 we reject the null hypothesis and accept the alternative hypothesis. When p < 0.05 it lies in the region as shown below.
 |
|---|
| P region. |
There are various ways to calculate p value one of the is Chi Square Test which we will use here.
So, when to use which test?
- When there is one categorical feature use One Sample Test.
- When there is two categorical feature use Chi Square Test.
- When there is one continuous feature like weight or height use T Test.
- When there are two continuous features like weight and height use Pearson correlation. And apply T test.
- When there is one continuous variable and one categorical feature with two category use T Test.
- When there is one continuous variable and one categorical feature with more than two category use Anova Test.
Code for finding out the p-value using T Test: GitHub Link