Learn KMeans clustering in simplified way with visualisation.

In this article will not only see what Kmeans clustering is but also visualise each and every step. But before jumping on directly to KMeans clustering directly like this
will like to give you some overview.
Let’s get started..!!
So there are two types of machine learning one is supervised and another is unsupervised learning.But Kmeans clustering falls under unsupervised learning so we will focused on that.
What is Unsupervised learning ?
In unsupervised learning data is not labelled.The model learn on its own and classifies it.
Clustering is a part of unsupervised learning and it is further divided into 3 sections as follows
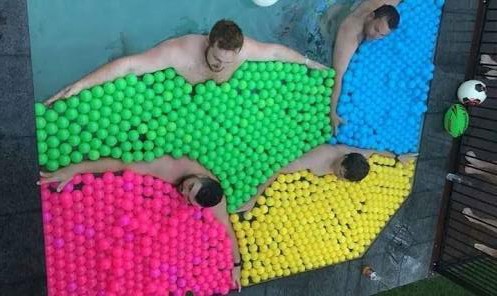
Exclusive Clustering
- It is a hard cluster.
- One data object only belongs to one cluster.
- eg: KMeans Clustering.
 |
|---|
| Exclusive Clustering |
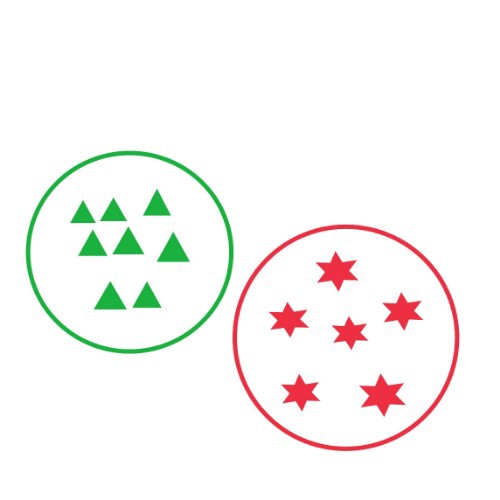
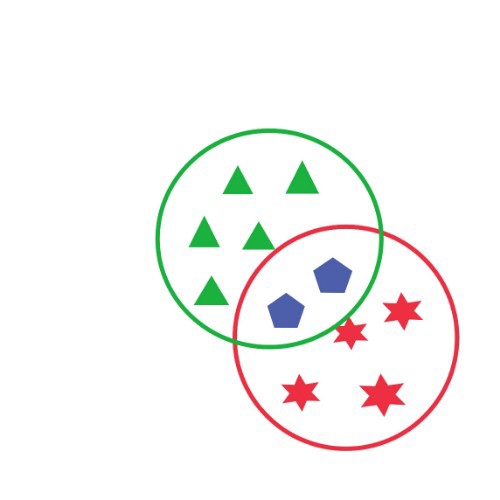
Overlapping Clustering
- It is a Soft cluster.
- One data object can belong to multiple clusters.
- eg: Cmeans and Fuzzy.
 |
|---|
| Overlapping Clustering |
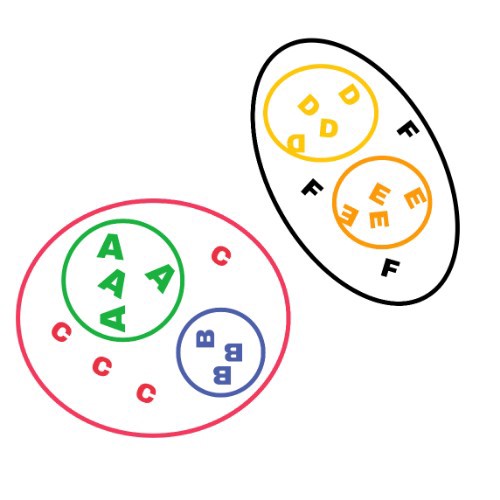
Hierarchical Clustering
- In this there are small clusters inside a big cluster. For example in below image, A and B are two small cluster are present inside a big cluster C and also D and E are two small cluster that are present inside a big cluster F.
- eg: Dendrogram.
 |
|---|
| Hierarchical Clustering |
I think I’m able to give you the overview of unsupervised learning and clustering.Now we will go deep in the kMeans clustering.
What is the significance of ‘K’ in KMeans Clustering ?
K stand for number of clusters.The main goal of KMean clustering is to find out this cluster based on the features provided.The Data points with similar features are grouped together in to one cluster.
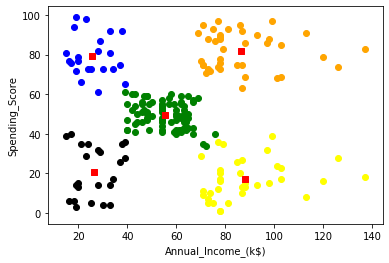
Below figures show before and after using KMeans Clustering.Here value of K is 5.
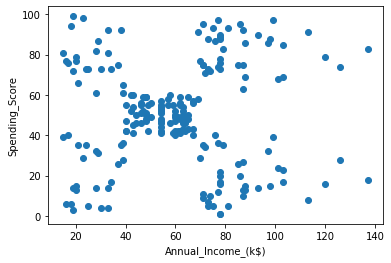 |
|---|
| Before KMeans clustering |
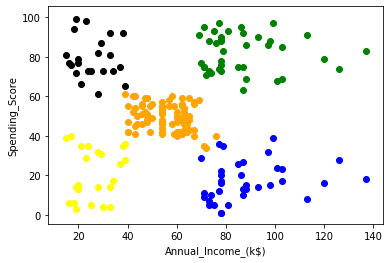 |
|---|
| After KMeans clustering |
Step 1 Is to find the K
So deciding the K is very much important. How to decide the value K…?
Sometimes it is easy to find the K by visualising the data. But maximum number of times it is not the case.So we have to use a method called as elbow method which we will discuss later.
Step 2 Is to select the K points This points can be from your data points or any random points. This points will be consider as the centroids.
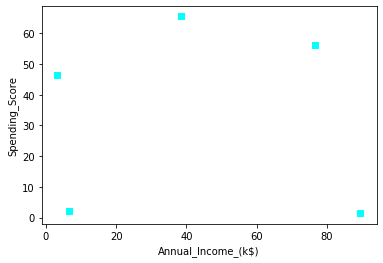 |
|---|
| Selecting K points |
Step 3 To allocate the data points to the centroids as shown below. We have to find the the data points that are closet to this centroid points and allocate this data points to the centroids this will lead to K cluster.
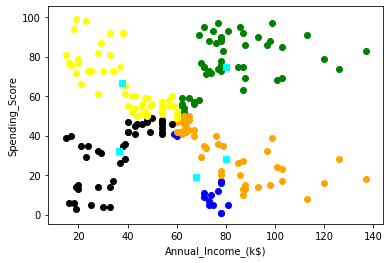 |
|---|
| Allocate the data point to the centroids |
Step 4 Reassignment of the centroids if required. So now we have to reassign the centroid after calculating the new centroid.As show in the below figure it the centroid reassignment started from Cyan colour and finally ended at Red.
|
|---|
| Centroid reassignment by doing several iteration |
And the final Result.
 |
|---|
| Final five cluster |
Elbow Method
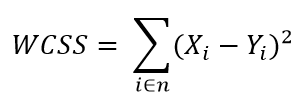
Value of K is decided based on a factor called as WCSS which stands for “Within Cluster Sum of Squares”.It sum of the distance between the centroid and the data points present in that cluster.
 |
|---|
| WCSS formula |
JUST FOR UNDERSTANDING So let us consider a dataset having 9 rows and we consider K as 9 so what will happen..? Obviously value of the WCSS will be zero because your number of centroid and data points are same.
And what will happen if K is 1..? Obviously value of the WCSS will be highest.
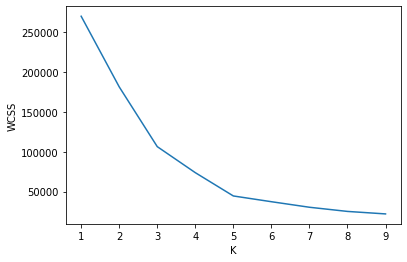
So between this high and low value of WCSS there will an optimal point which is 5 in our case .We can see in the below figure from were the value of WCSS will decrease considerably less and finally it will become zero. And it looks like elbow so it is called as Elbow method.
 |
|---|
| Elbow Method |
Random Initialisation Trap
When we select the centroids randomly as shown in the figure below your cluster will look like this which is actually not correct compared to our final result.So it is better to select the centroids from our data points.
|
|---|
| Random Initialisation Trap |
Now you have learnt about KMeans Clustering so to develop your interest more. I would like to mention the practical applications.
It is very much used in the e-commerce website where they show you the recommendation based on the things which you searched or you ordered so that you can order more things from there website.
It is also used in the various streaming platform to show you the shows and movies recommendation by which they can keep you engaging on there platform. It is also used on image segmentation, customer retention, fraud detection. And much more…..
You can also think of idea and try to build a project around it.